Mapping Legal Permanent Residents with DataKind and ILRC
I recently volunteered with DataKind and had the chance to lead a team of fellow volunteer data scientists on a six-month long pro-bono project for the Immigrant Legal Resource Center’s (ILRC) New Americans Campaign to analyze and visualize the demographics and geography of lawful permanent residents eligible for naturalization, allowing Campaign partners to be more effective in their outreach and naturalization work.
Background
My Motivation
I’m always interested in using my data science skills to make a difference in the community around me. So when I heard about DataKind’s mission to harness the power of data with impactful projects to solve social and humanitarian problems, I knew I wanted to be part of it! In the fall of 2016, I had the opportunity to work on a project with the ILRC to help immigrant communities pursuing U.S. citizenship receive legal assistance to aid in the process. As a second generation immigrant, this topic is near and dear to my heart. I have family members that have been long time green card holders but never took the step in applying for citizenship, which means they are missing out on possible civic engagement and additional benefits. Moreover, the new administration’s stance against immigrant groups has made this work even more urgent.
The Partners: ILRC and the New Americans Campaign
The Immigrant Legal Resource Center (ILRC) works with immigrants, community organizations, legal professionals, law enforcement, and policy makers to build a democratic society that values diversity and the rights of all people. The ILRC’s mission is to protect and defend the fundamental rights of immigrant families and communities. Led by the ILRC, the New Americans Campaign is a diverse nonpartisan national network of respected immigration organizations, legal services providers, faith-based organizations, immigrant rights groups, foundations and community leaders. The Campaign transforms the way aspiring citizens navigate the path to becoming new Americans. It is committed to connecting lawful permanent residents (LPRs) to trusted legal assistance and critical information that simplifies the naturalization process.
The Goal
The ILRC wanted to be able to visualize the geographic and demographic makeup of LPRs that are eligible for naturalization so that New Americans Campaign partners could identify those that might require the Campaign’s assistance.
The Data
There is a good amount of data around immigrants and LPRs in the U.S. including sources such as:
- US Census Bureau
- American Community Survey
- US Citizenship and Immigration Services
- Homeland Security
There are also several research organizations who work extensively with this immigrant population, and their work was tremendously helpful to our project. These partners include:
Although much of the data around immigrants and LPRs is public and available to the ILRC and its partners, it is not easy to navigate the many disparate websites or download large spreadsheets of numbers. We wanted to help make this information more accessible to the organizations that are serving this immigrant community.
Our team leveraged the excellent research that has already been done by CMS and CSII, which estimates the demographic and characteristics of immigrant populations at a detailed geographic level using PUMA. We then compared this with the New Americans Campaign’s internal data to gauge the effectiveness of past outreach and to find new opportunities for local partners.
Visualizing LPRs
After cleaning and wrangling the data, we started the visualization process. We wanted to develop an easy-to-use map that would show the appropriate characteristics of lawful permanent residents in corresponding PUMA area. Once we converted our data with PUMA’s shape files into a GeoJSON, we were able to create the visualization using D3.js.
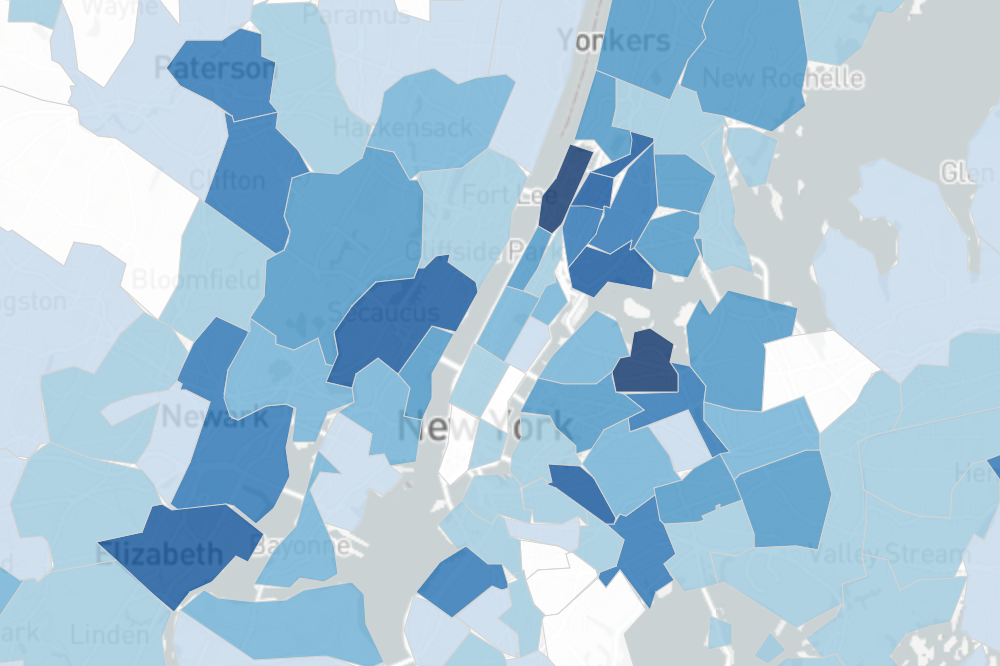
 Initial visualization of demographic by PUMA using D3.js
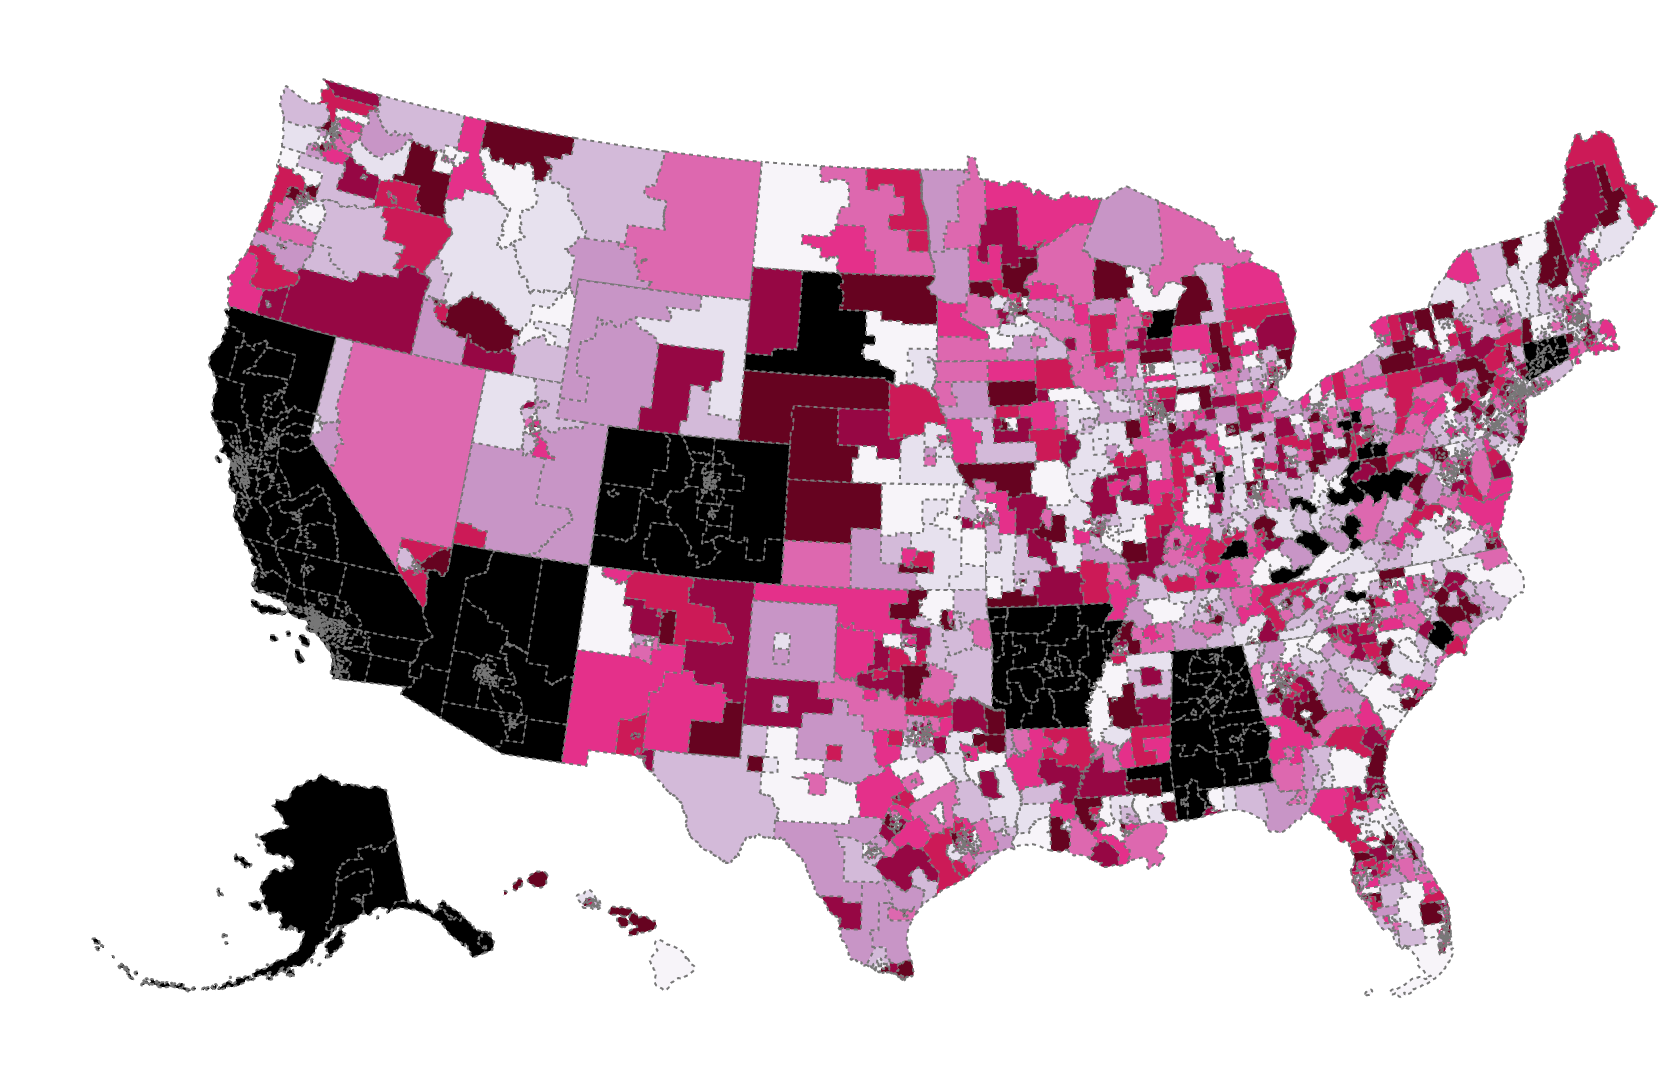
Next, we attempted to add functionality and usability with off-the-shelf solution such as CartoDB:
Interactive map of Spanish speakers and education levels using CartoDB
We extensively tested tools such as CARTO, Mapbox, and Tableau that generated great looking visualizations, but we were concerned about the maintenance cost to the partner and the limitation of free tier levels that require opening up the Campaign’s internal data to the public. With help from DataKind’s in-house team of data scientists, we were able to develop a fully functional web app that uses Leaflet.js to serve as an interactive map that looks great and is flexible.
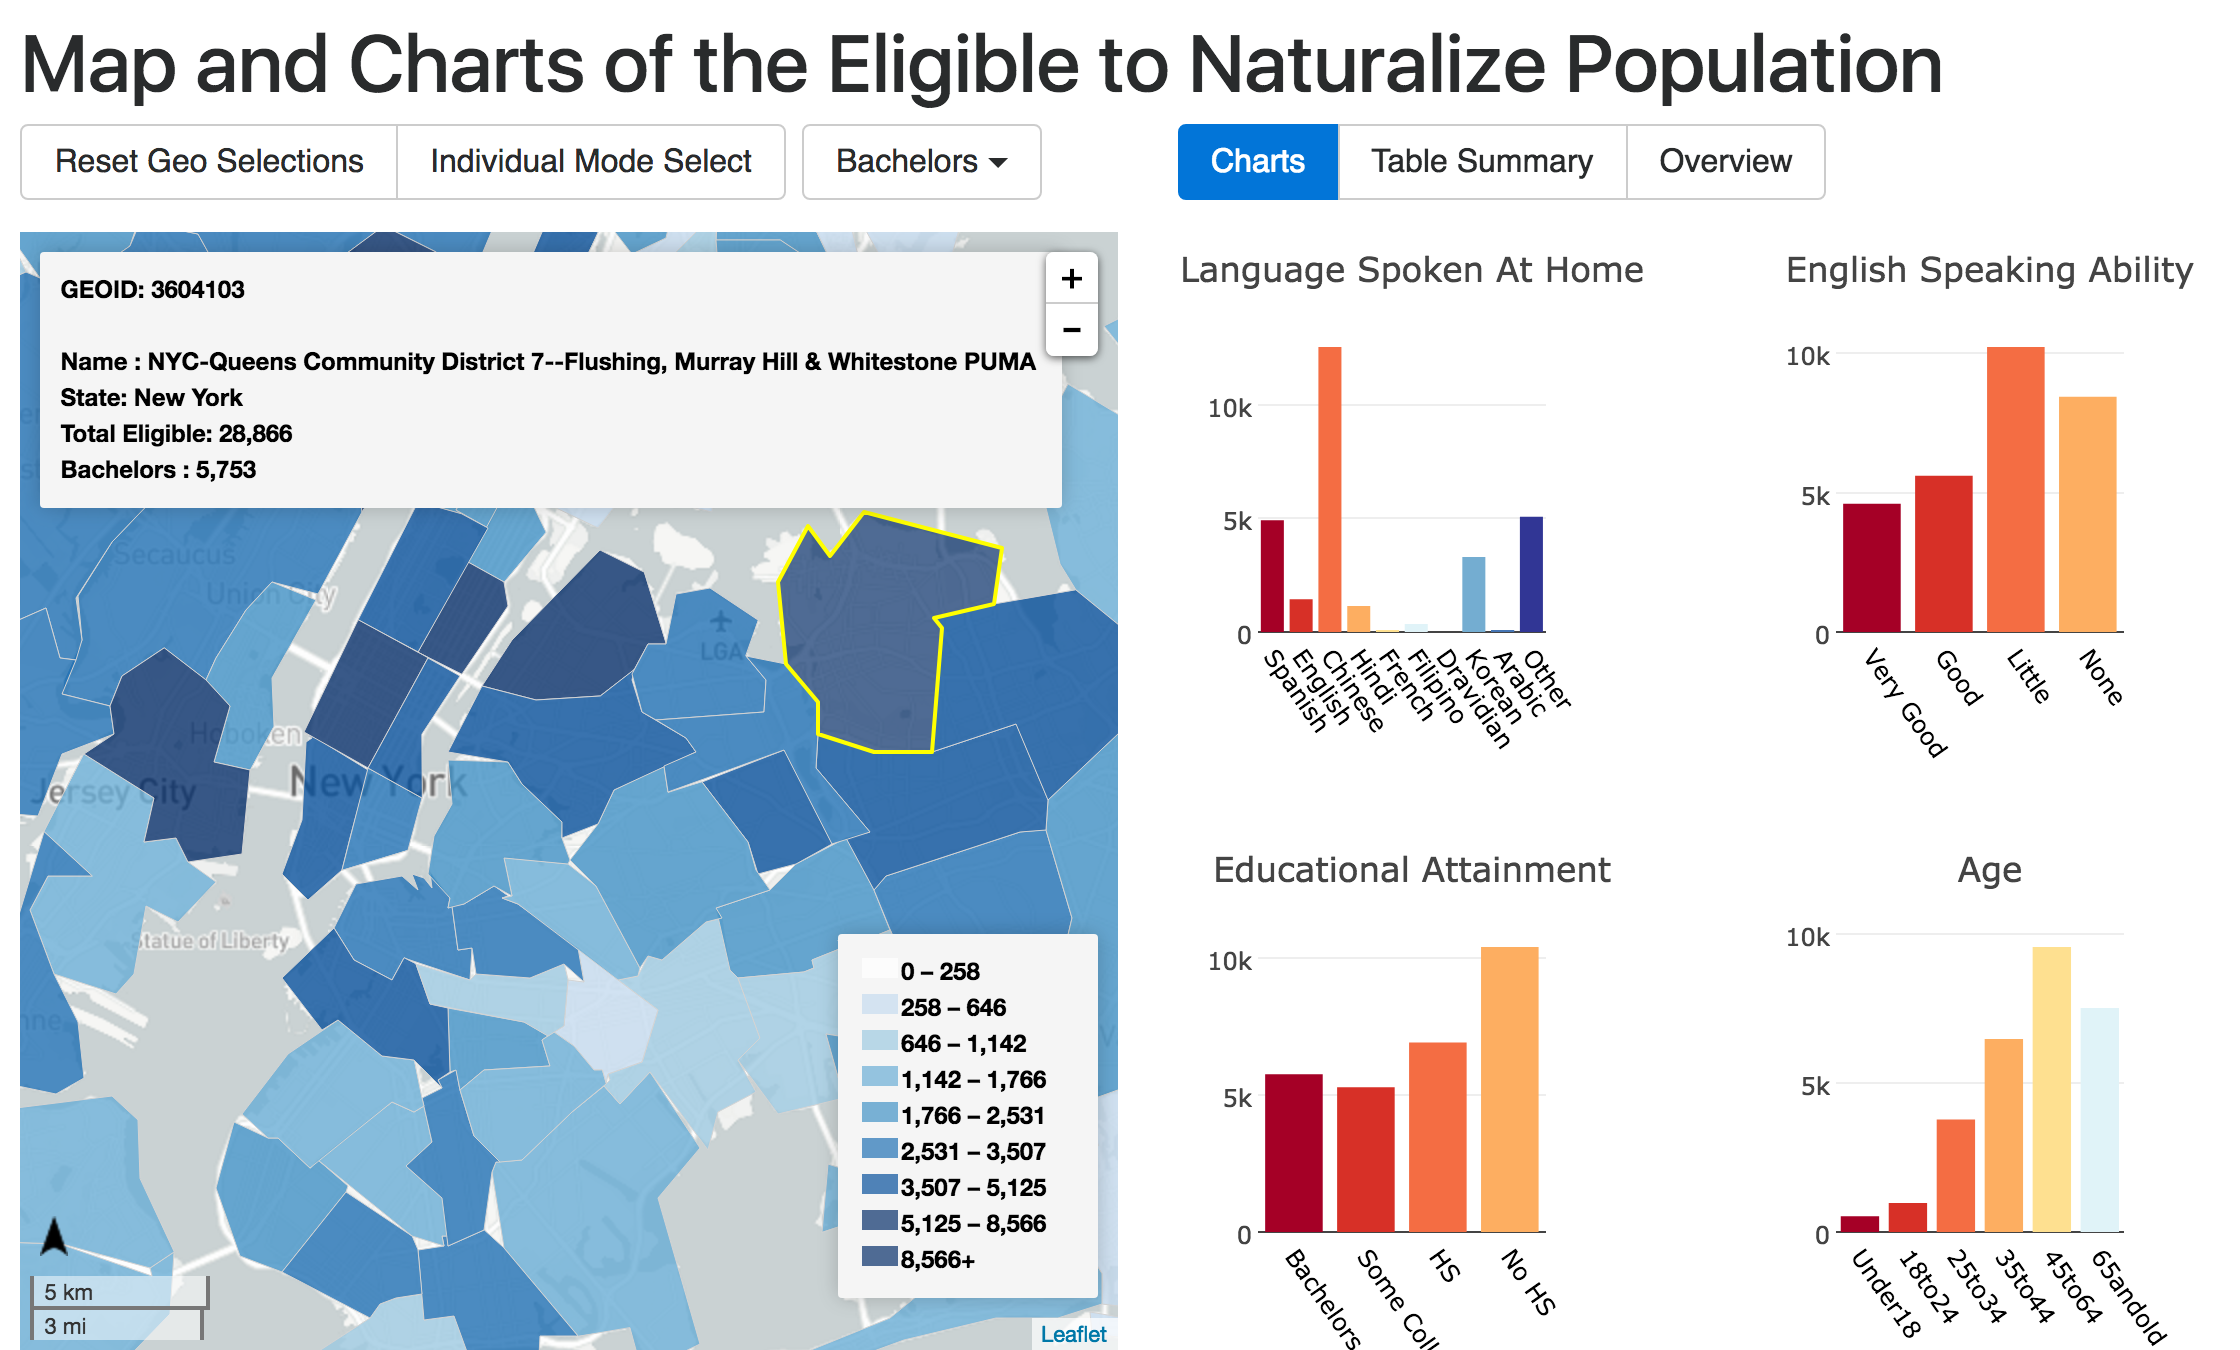 Final prototype of the tool showing LPRs with Bachelor degree and higher in the
NYC metro area
Final prototype of the tool showing LPRs with Bachelor degree and higher in the
NYC metro area
Above is the final version of the app that we provided to the ILRC and New Americans Campaign partners. The left hand side is an interactive map that shows the raw number of LPRs given a selected characteristic by PUMA areas. On the right is a detailed view of each characteristic of the selected areas.
Wrapping Up
After the project was completed, I had the chance to join Campaign partners in Chicago for the national New Americans Campaign Conference, where I led three workshops to unveil and demo the tool we had developed to all the attendees. I encouraged everyone to get out their laptops and smartphones, and actually play with the map as I presented the features. We then discussed the ways this tool could potentially help Campaign partners be more effective.
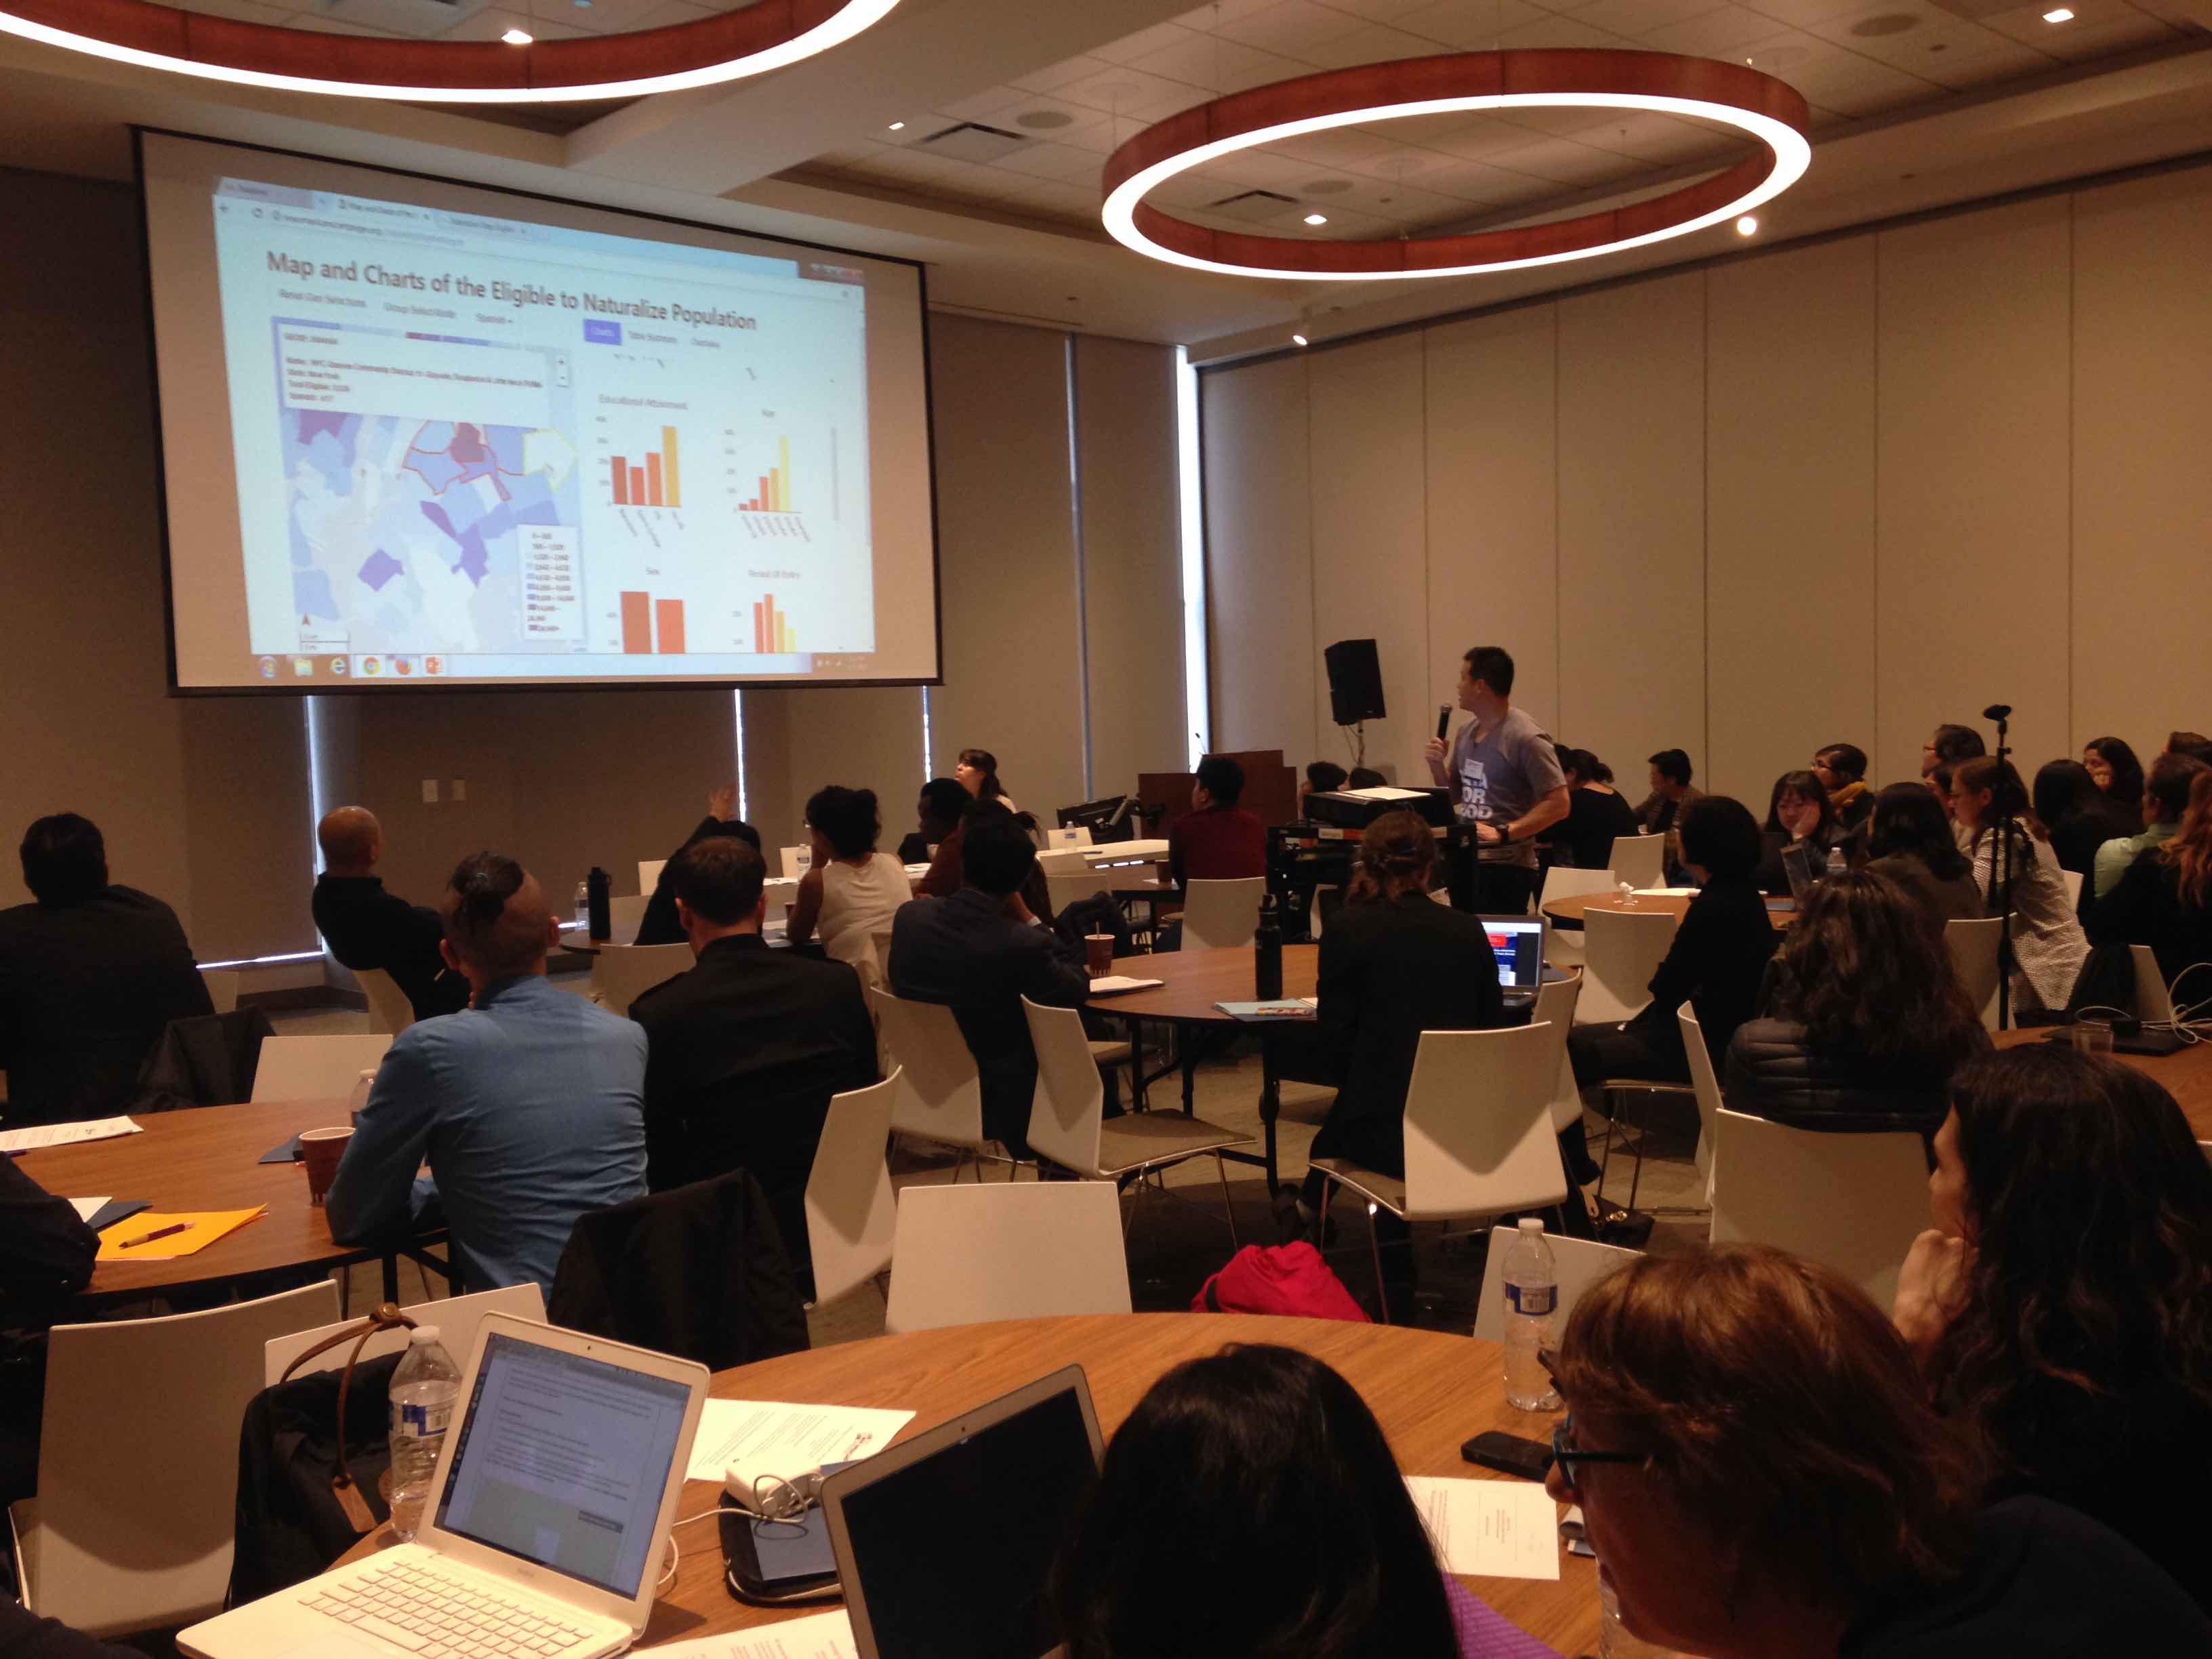 Me leading a live demo of the tool at the 2017 New Americans Campaign Conference in Chicago
Potential Impact
The feedback from the partners after the workshops was overwhelmingly positive (I even got some hugs). For some, this was the first time that the data was presented in a way that they could both understand and immediately use.
Together we brainstormed some of the ways that this tool could help the partners:
- Now that areas where certain demographics and characteristics were once unclear, were now apparent, more targeted and effective outreach could be planned. One partner in Florida had planned to make a 6-hour roundtrip drive, twice a week, to be able to reach out to a specific immigrant group in the area. After using the map at the workshop, he discovered that a population with the same demographics he wanted to reach out to existed just 30 minutes away from his office.
- Partners could use this tool to better prepare for offsite events or office visits, target outreach and plan necessary resources. For example:
- Partners would be able to know in advance if they are serving an area where there is not a high-level of fluency in English, so that they could have translators on site.
- Partners could identify LPRs that are younger and more computer savvy, and introduce them to Citizenshipworks, a “TurboTax” like program that can expedite the naturalization application form-filling process.
- Partners could find LPRs that have lower income, as they may qualify for a fee-waiver.
- Partners could develop more strategic planning to expand to new areas and seek funding.
It’s been a wonderful experience for our DataCorps team to work with the ILRC and I am very excited to see how the New Americans Campaign partners will use our tool to advance their work!
-->