Optimal Street Team Placement for WomenTechWomenYes
This is our first project at Metis. Assigned at the first day of class and due on the same Friday, we work in groups to help WomenTechWomenYes raise funds and promote awareness of women in technology. Here’s part 1 of my analysis.
Question
We received a project request from WomenTechWomenYes in the following email:
WomenTechWomenYes (WTWY) has an annual gala at the beginning of the summer each year. As we are new and inclusive organization, we try to do double duty with the gala both to fill our event space with individuals passionate about increasing the participation of women in technology, and to concurrently build awareness and reach.
To this end we place street teams at entrances to subway stations. The street teams collect email addresses and those who sign up are sent free tickets to our gala.
Where we’d like to solicit your engagement is to use MTA subway data, which as I’m sure you know is available freely from the city, to help us optimize the placement of our street teams, such that we can gather the most signatures, ideally from those who will attend the gala and contribute to our cause.
The ball is in your court now—do you think this is something that would be feasible for your group? From there we can explore what kind of an engagement would make sense for all of us.
Approach
Our team approached WTWY’s project by analyzing 3 data sources to identify the best subway stations to place street teams.
We recognize that our client wants to build awareness and reach of women in technology through a summer gala open to everyone that’s interested, but also those that can benefit their fundraising efforts. Of course, we want to target the most popular subway stations, but we also examine city demographic and tech company distributions for the areas that would be interested. Finally, we look at the best time of day to place the street teams. We weigh these 3 factors to recommend the best street team placements.
As the gala takes place in early summer, we focus our analysis on a comparable time period in the late spring season: April - June.
In summary, we look to:
- Place street teams at the busiest subway entrances…
- … in the areas with people who will be most interested in the event…
- … at the most effective times of the day.
Team Members
Data Sources
- MTA Turnstile Data
- US Census Data
- American Community Survey
- Giving Ratio from Philantrophy.com
- Business Types from Census
Data Wrangling / Preprocessing
The MTA turnstile data is quite complex and not immediately useful.
Here’s a snippet of the raw data obtained from the MTA:
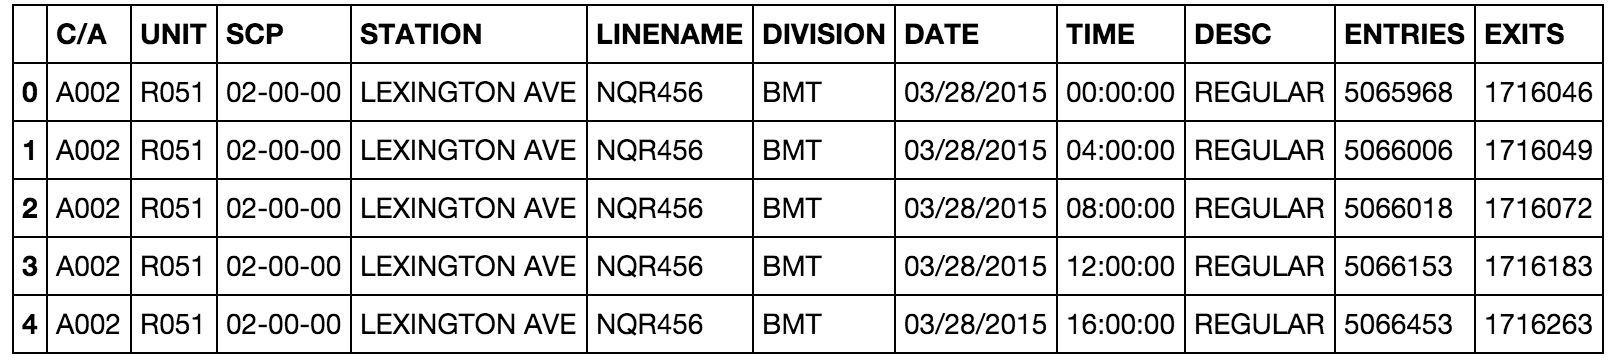
There are detailed description of the turnstile file on the MTA website, but here’s a quick rundown of the fields I need:
- STATION is the name of the subway station
- C/A or Control Area is basically a “Fare Control Area”, a vestibule with a booth
- UNIT or remote unit is a bank of turnstiles in the control area.
- SCP is Subunit Channel Position or the unique identifier for the turnstile in that control area.
- ENTRIES and EXITS are the turnstile’s counter. It’s recorded 6 times a day in 4 hour blocks, and it’s a running cumulative total.
One caveat: Different stations on different lines but on the same street may have the same station name, e.g. The station designation “23 ST” is used for 4 unique stations: C/E, 1, F/M, and 6 line. They have different C/A and remote UNIT. As we’ll see later, this may affect our aggregation.
Using the power of Pandas and Python, I transform the raw data into workable dataframes. The critical part here is to find the difference for each time frame to find the actual number of entries and exits. I also remove any anomalies in the count.
For the complete code with reusable functions, see my Ipython Notebook on Github.
MTA Subway Turnstile Analysis
First, I just look at the subway data and see what kind of information I can gather.
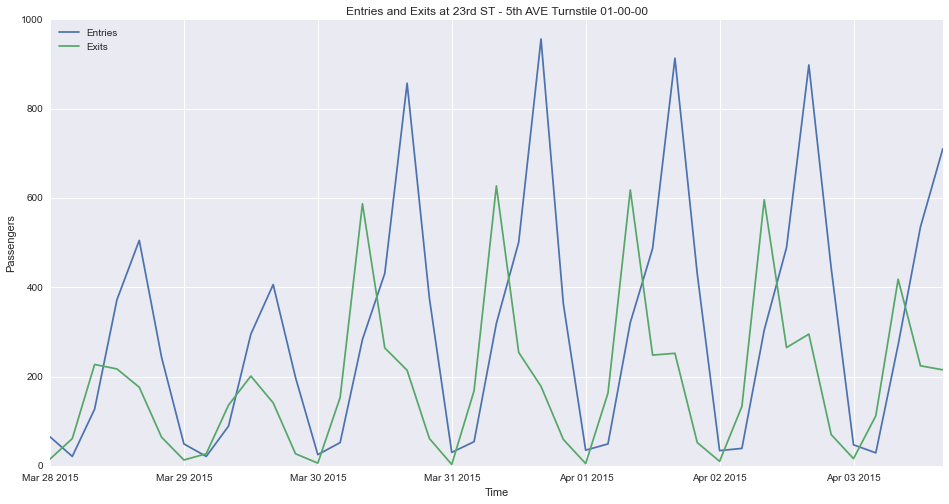
Here are 2 plots of entries and exits during the week ending April 4th 2015.
This specific turnstile is at my local N/R subway stop here in Madison Square Park.
The blue line indicate entries and green line is for exits. This is for one
turnstile:
 And this is for the entire station:
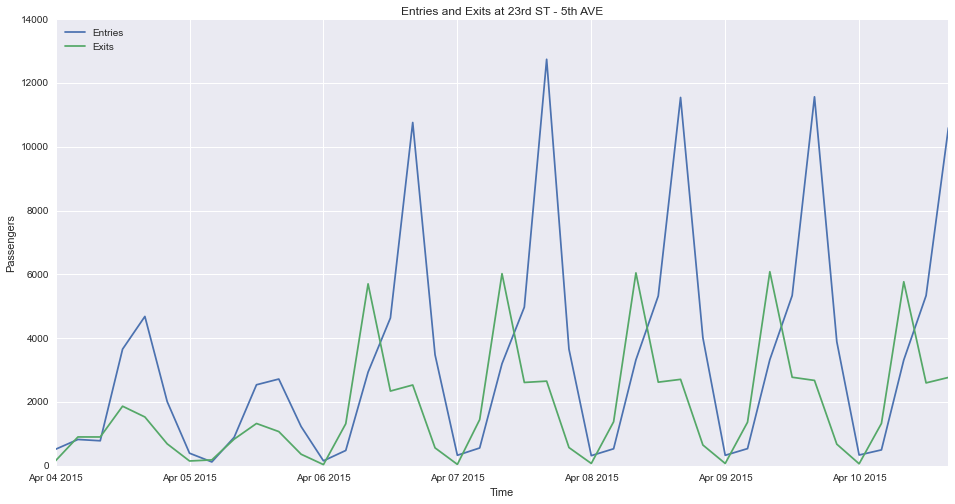
A few observations jump out here:
- Weekend usage at this station is significantly lower. (Reported week starts with Saturday and Sunday)
- There’s a spike in exits in the morning, while entries are higher later in the day. There are a lot of offices in this area, so it makes sense that people are taking the subway to work.
- Morning exits averages about 6,000 people, but where are the additional 4,000-6,000 people entering in the afternoon coming from? Maybe the plateau in exits might explain it; perhaps people are only visiting this area for a few hours in the PM?
With some more grouping, I can make a cool looking chart of all the turnstiles
at this station:
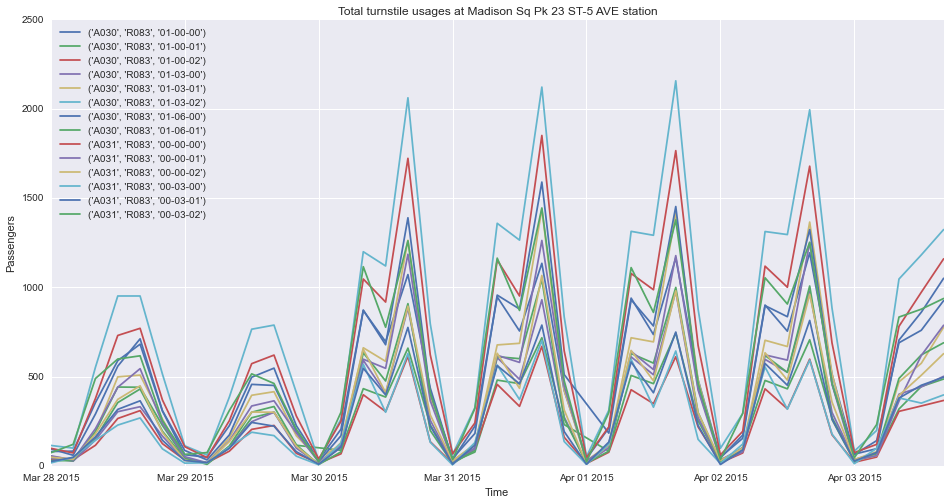
That was fun, but this graph is pretty busy. We do see that one turnstile in particular (01-03-02) is used much more than the others though. I wonder what the story here is…
OK, back to business. It’s straight forward to find the busiest stations in the
entire system during the same week:
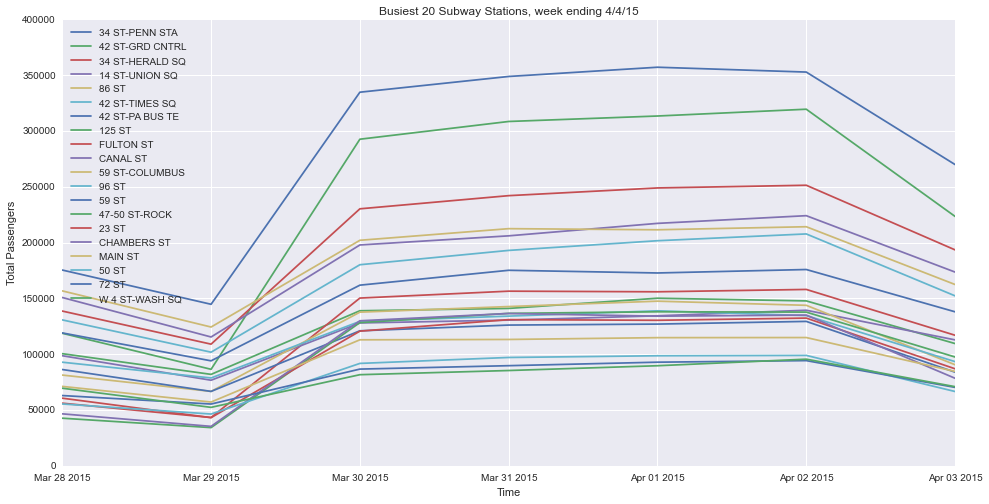
Top 10 Busiest Subway Stations - Week ending 4/4/2015
Grouped only by STATION

STATION             ENTRIES     EXITS      TOTAL
34 ST-PENN STA    1,057,437   926,188  1,983,625
42 ST-GRD CNTRL     881,720   781,065  1,662,785
34 ST-HERALD SQ     737,810   675,999  1,413,809
14 ST-UNION SQ      678,636   606,453  1,285,089
86 ST               690,065   593,711  1,283,776
42 ST-TIMES SQ      605,890   561,544  1,167,434
42 ST-PA BUS TE     563,733   473,070  1,036,803
125 ST              484,665   385,149    869,814
FULTON ST           449,062   388,010    837,072
CANAL ST            452,381   368,083    820,464
This makes a lot of sense. These are expectedly, the busiest stations in NYC. But wait! Is 86th Street really busier than 42nd St. Port Authority? And 125th Street is in the top 10 too?
I mentioned this before, but it turns out some stations share the same name even though they serve different lines and are geographically separate. I’ll have to group them differently now.
Busiest Subway Stations - Week Ending 4/4/2015
Grouped by STATION and LINENAME

STATION          LINENAME           TOTAL
42 ST-GRD CNTRL  4567S          1,747,385
34 ST-HERALD SQ  BDFMNQR        1,419,312
42 ST-TIMES SQ   1237ACENQRS    1,046,048
34 ST-PENN STA   ACE            1,021,613
42 ST-PA BUS TE  ACENQRS1237      896,345
14 ST-UNION SQ   LNQR456          815,698
86 ST            456              754,797
47-50 ST-ROCK    BDFM             739,774
MAIN ST          7                648,390
59 ST            456NQR           604,764
59 ST-COLUMBUS   ABCD1            603,226
34 ST-PENN STA   123ACE           573,880
W 4 ST-WASH SQ   ABCDEFM          552,484
OK. Much better. Now what I’m really after is the daily average across the spring season. So I crunch 13 week worth of data in the spring of 2015 to obtain:
Top 10 Busiest Stations - Spring 2015 (4/4/15-6/27/15)
                              AVERAGE WEEKLY
STATION          LINENAME       RIDERSHIP
42 ST-GRD CNTRL  4567S          1738601.0
34 ST-HERALD SQ  BDFMNQR        1411616.0
42 ST-TIMES SQ   1237ACENQRS    1008596.0
34 ST-PENN STA   ACE             985054.1
42 ST-PA BUS TE  ACENQRS1237     869653.9
14 ST-UNION SQ   LNQR456         864844.1
86 ST            456             776311.3
47-50 ST-ROCK    BDFM            713272.9
MAIN ST          7               680105.1
59 ST-COLUMBUS   ABCD1           661871.7
In part 2, I look at the socio-economical factors for our subway stops and find the best time of day to recommend street team placements.
-->